| Example of the LaTeX picture environment |
LaTeX has a picture environment that you can use for
simple line drawings. For more sophisticated graphics, you will
want to use a different tool. Here is a simple example of
LaTeX code that creates the graph of a step function
suitable for illustrating a problem about Fourier series.
\begin{picture}(200,75)
\put(0,25){\vector(1,0){200}}
\put(25,0){\vector(0,1){75}}
\put(75,22){\line(0,1){6}}
\put(125,22){\line(0,1){6}}
\put(22,50){\line(1,0){6}}
\thicklines
\put(25,25){\line(1,0){50}}
\put(75,50){\line(1,0){50}}
\put(125,25){\line(1,0){72}}
\put(17,50){\makebox(0,0){$1$}}
\put(75,13){\makebox(0,0)[b]{$\pi$}}
\put(125,13){\makebox(0,0)[b]{$2\pi$}}
\put(195,13){\makebox(0,0)[b]{$t$}}
\put(175,60){\makebox(0,0){$g(t)$}}
\end{picture}
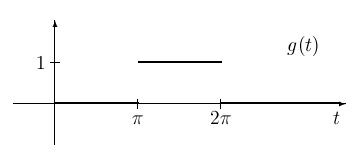
If you use the mouse to cut and paste this example into a LaTeX document, you should get a result like the one shown.
| Example of the LaTeX picture environment |